
This Event is licensed under the Creative Commons BY-SA license. This license allows reusers to distribute, remix, adapt, and build upon the material in any medium or format, so long as attribution is given to the creator. The license allows for commercial use. If you remix, adapt, or build upon the material, you must license the modified material under identical terms.
Key Event: 1542
Key Event Title
Inhibition, Mitochondrial complex III
Short name
Exploration Options for Key Events
Click links below to explore KE 1542, Inhibition, Mitochondrial complex III in tools offered by third parties.
Biological Context
| Level of Biological Organization |
|---|
| Molecular |
Cell term
| Cell term |
|---|
| eukaryotic cell |
Organ term
| Organ term |
|---|
| organ |
Event Components
| Process | Object | Action |
|---|---|---|
| Decreased activity of mitochondrial complex III | mitochondrial respiratory chain complex III | decreased |
Key Event Overview
AOPs Including This Key Event
| AOP Name | Role of event in AOP | Point of Contact | Author Status | OECD Status |
|---|---|---|---|---|
| Mitochondrial complex inhibition leading to liver injury | MolecularInitiatingEvent | Wanda van der Stel (send email) | Under development: Not open for comment. Do not cite | |
| Mitochondrial complex III antagonism leading to growth inhibition (1) | MolecularInitiatingEvent | You Song (send email) | Under development: Not open for comment. Do not cite | |
| Mitochondrial complex III antagonism leading to growth inhibition (2) | MolecularInitiatingEvent | You Song (send email) | Under development: Not open for comment. Do not cite | |
| Mitochondrial dysfunction and Neurotoxicity (cIII) | MolecularInitiatingEvent | Barbara Viviani (send email) | Under development: Not open for comment. Do not cite |
Taxonomic Applicability
| Term | Scientific Term | Evidence | Link |
|---|---|---|---|
| rat | Rattus norvegicus | High | NCBI |
| humans | Homo sapiens | High | NCBI |
| zebrafish | Danio rerio | High | NCBI |
| mouse | Mus musculus | High | NCBI |
| yeast | Saccharomyces cerevisiae | High | NCBI |
| Pneumocystis jiroveci | Pneumocystis jirovecii | High | NCBI |
| Plasmodium falciparum | Plasmodium falciparum | High | NCBI |
Life Stages
| Life stage | Evidence |
|---|---|
| All life stages | High |
Sex Applicability
| Term | Evidence |
|---|---|
| Male | High |
| Female | High |
Key Event Description
The mitochondrial complex III, also known as cytochrome bc1 complex, is located in the inner mitochondrial membrane. It is the third of the five complexes that form the mitochondrial respiratory chain. It contains three catalytic subunits, cytochrome b/b6, cytochrome c1 and the Rieske iron–sulfur protein an (2Fe-2S cluster).
Complex III catalyzes electron transfer from ubiquinol (QH2) deriving from complex I, complex II and other mitochondrial systems, to cytochrome c. The complex has two functional binding sites for quinone, one is the oxidation site of quinone (QP or QO) on one side of the intermembrane space, close to heme b. The other is the quinone reduction site (QN or QI) on the matrix side, close to heme bH (Hunte et al, 2003).
The electron transfer in this process mediates the translocation of protons from the mitochondrial matrix through the inner membrane to the intermembrane space. The created proton gradient will be used to catalyze the reaction in which ADP is converted into ATP.
In functional mitochondria, Complex III can be found as free complex or in association with Complex I and Complex IV (CI-CIII2-CIV) in supramolecular structures called respirasomes (Letts & Sazanov, 2017).
The initiation event is the reversible or irreversible interaction to any of the subunits in the mitochondrial complex III, leading to an perturbation of the electron flow and an absence of proton transport via this complex.
In most cases, inhibition of Complex III occurs upon binding of inhibitors to one of the two quinone binding sites. Specific binding to the quinol oxidation site (QP or QO site), blocks the motion of the iron-sulfur protein subunit. Binding to this site confers to inhibitors selectivity between mammalian vs protozoan (Esser et al, 2023) or pests Complex III (Luo et al, 2022).
How It Is Measured or Detected
Activity of complex III of the respiratory chain can be determined indirectly by the detection of oxygen consumption as a readout for the activity of oxidative phosphorylation in entire mitochondria. Direct enzymatic activity measurements include spectrophotometric assays. Detection of oxygen consumption is conducted either in permeabilized cells to allow unrestricted access of substrates and inhibitors to mitochondria or in isolated mitochondria. Direct enzymatic assays are performed in isolated mitochondria, or submitochondrial particles.
Detection of complex III activity in isolated mitochondria or in submitochondrial particles by spectrophotometry.
The decylubiquinol/cytochrome c reductase assay is the standard spectrophotometric method to measure the enzymatic activity of mitochondrial complex III (ubiquinol–cytochrome c reductase) (Krähenbühl et. al, 1994). The principle of the assay is based on the physiological role of complex III, which catalyzes the transfer of electrons from ubiquinol (QH₂) to cytochrome c in the respiratory chain. In the assay, the artificial substrate decylubiquinol (DB), a soluble analog of ubiquinol with a shortened aliphatic side chain, serves as the electron donor (Xia et al., 2013). Decylubiquinol is oxidized by complex III at the Qo site of cytochrome b, and the released electrons are transferred sequentially through the Rieske iron–sulfur protein and cytochrome c₁ subunit to the terminal electron acceptor, cytochrome c. The reduction of cytochrome c results in a characteristic increase in absorbance at approximately 550 nm, which can be continuously monitored using a spectrophotometer. The rate of cytochrome c reduction is directly proportional to the activity of complex III in the sample (Krähenbühl et. al, 1994). To ensure specificity, the assay is performed in the presence and absence of antimycin A, a potent inhibitor of the Qi site of complex III (Bujan et al., 2022). The difference between the total rate and the antimycin-insensitive rate defines the antimycin-sensitive activity, which corresponds to the true activity of complex III. This control is essential, as cytochrome c can also be reduced by other mitochondrial enzymes or non-specific redox reactions.
Complex III activity detection is conducted according to the reaction:
DB (reduced) + cytochrome c (oxidized) → DB (oxidized) + cytochrome c (reduced) (550 nm)
The reaction is measured in a buffer consisting of: 50 mM potassium phosphate, pH 7.4, 1 mM n-dedecylmaltoside, 1 mM KCN, 2,5 µM rotenone, and 0.1 fatty acid free BSA (fraction V) . (Bujan et al., 2022; Krähenbühl et al., 1994).
The sample is added to the reaction buffer, and allowed to equilibrate for a few minutes at 30 °C. Then, reduced decylbenzylquinone is added (100 µM), in parallel a blank sample without reduced DB is prepared. The reaction is initiated by the addition of cytochrome c (15 µM), absorbance is detected after a lag phase of ca. 20 sec. in 30 sec. intervals over a period of 3-5 min. Absorbance is measured at 550 nm. At the end of the recordings, an excess amount of ascorbic acid (50 mM) for full cytochrome c reduction is added, the resulting absorbance value is detected separately.
The results are calculated as first-order rate constants as the reactions rapidly become non-linear. The final absorbance reading (ascorbic acid) are subtracted from each data point. The data are then plotted as a log plot against time, and the slope is the first order rate constant. (Bujan et al., 2022; Krähenbühl et al., 1994).
Complex III activity detection in permeabilized cells or in isolated mitochondria based on the detection of oxygen consumption.
The principle of oxygen detection by a Clark electrode is based on the electrochemical reduction of oxygen at a cathode, typically composed of platinum, which is maintained at a fixed potential relative to a reference electrode. The electrode system is immersed in an electrolyte solution and separated from the sample medium by an oxygen-permeable membrane, commonly made of Teflon or polyethylene. Oxygen from the sample diffuses through the membrane into the electrolyte, where it undergoes reduction at the cathode surface according to the reaction:
O₂ + 4e⁻ + 4H⁺ → 2H₂O (in acidic medium) or
O₂ + 2H₂O + 4e⁻ → 4OH⁻ (in neutral or alkaline medium).
The rate of oxygen diffusion through the membrane, and thus the magnitude of the resulting cathodic current, is directly proportional to the partial pressure or concentration of dissolved oxygen in the sample (Li et al. 2012; Silva et al. 2012). This current is measured and converted into an electrical signal, which can be quantitatively related to oxygen concentration. To ensure accuracy and stability, the electrode is often maintained at a constant temperature, and the membrane thickness and electrolyte composition are carefully controlled. The Clark electrode, by providing real-time and continuous measurements, is widely used in biomedical, environmental, and industrial applications for monitoring oxygen levels.
Optical oxygen sensors operate on the principle of dynamic quenching of luminescence by molecular oxygen. These sensors typically utilize oxygen-sensitive fluorophores or phosphorescent dyes immobilized within an oxygen-permeable matrix (Melnikov et al. 2022; Dmitriev et al. 2012). In the absence of oxygen, the fluorophores exhibit a characteristic luminescence—either fluorescence or phosphorescence—with defined intensity and lifetime upon excitation by a specific wavelength of light. When molecular oxygen is present, it acts as a dynamic quencher, reducing the luminescence intensity and/or shortening the emission lifetime through a collisional quenching mechanism governed by the Stern–Volmer relationship. The degree of quenching is quantitatively related to the local oxygen concentration, enabling precise and non-invasive measurements. Unlike electrochemical sensors, optical oxygen sensors do not consume oxygen during detection, making them particularly suitable for applications requiring high spatial and temporal resolution under physiologically relevant conditions. Extracellular flux analyzers such as the Seahorse system emerged as the frontline technique in high content oxygen consumption detection (Plitzko et al. 2018). Optical oxygen sensors are integrated into the bottom of specialized microplates used for real-time measurement of cellular respiration. Fluorescent or phosphorescent oxygen-sensitive dyes are embedded in solid-state sensor patches adhered to each well. During an assay, a transient microchamber is formed above the adherent cells by lowering a sensor cartridge, temporarily isolating a small volume of medium. The consumption of oxygen by the cells within this microenvironment results in a measurable decrease in oxygen concentration, which is detected by changes in the fluorescence signal of the sensor.
This real-time, label-free detection enables the calculation of the oxygen consumption rate (OCR), a key parameter reflecting mitochondrial respiratory activity. When coupled with simultaneous measurement of extracellular acidification rate (ECAR), these data provide comprehensive insights into cellular bioenergetics, metabolic reprogramming, and mitochondrial function in live cells under various physiological and pharmacological conditions (Yoo et al. 2024; Zhang et al. 2019).
Due to its widespread use in current research and its applicability on a high-content scale, the following descriptions will consistently refer to the use of the fluorophore-based method.
Cell permeabilization
Controlled permeabilization of cells allows access to mitochondria in their natural environment without the time-consuming isolation procedures that affect mitochondrial function. The principle of cell permeabilization by agents such as digitonin and saponin is based on their ability to selectively disrupt the plasma membrane while preserving the integrity and functionality of intracellular organelles, particularly mitochondria. This selective permeabilization is essential for enabling the controlled introduction of exogenous substrates, ADP, and specific inhibitors directly to mitochondria within their native cellular context, thereby allowing accurate measurement of mitochondrial respiration (Salabei et al. 2014). Digitonin and saponin are amphipathic glycosides that interact preferentially with cholesterol-rich domains of biological membranes. The plasma membrane, which contains a relatively high cholesterol content, is particularly susceptible to disruption by these agents. In contrast, the mitochondrial inner membrane contains little cholesterol and is largely resistant to their action at appropriately optimized concentrations. When cells are treated with low concentrations of digitonin or saponin, the plasma membrane becomes permeable, allowing small molecules (e.g., metabolic substrates, ADP, respiratory inhibitors) to diffuse into the cytoplasm (Divakaruni et al. 2014; Niklas et al. 2011; Lei et al. 2021). This creates a semi-intact cell model in which mitochondrial membranes remain functionally intact, and mitochondrial respiratory activity can be assessed in a highly controlled, substrate-specific manner. Importantly, the preservation of mitochondrial integrity ensures that electron transport, membrane potential, and ATP synthesis can be reliably studied. Selective permeabilization using digitonin or saponin provides an experimental platform, bridging the gap between isolated mitochondria and intact cells, and is particularly compatible with high-resolution platforms like the Seahorse XF Analyzer.
Complex III activity in permeabilized cells
In the 96 well format, a cell density in the range of 30.000-80.000 cells per well (depending on the cell type) is added in a volume of 80 µl and centrifuged (200 g for 1 min) to ensure attachment on the bottom of the plate. Depending on the cell type, the cells are then allowed to attach for a certain time period (e.g. 24 h) to ensure proper attachment. If cells in suspension are employed, the measurements can be initiated immediately. Following treatment of the cells, permeabilization is initiated according to the protocols described in Salabei (2014) or Delp (2019). In brief, permeabilization is initiated by MAS buffer (220 mM mannitol, 1 mM ADP, 70 mM sucrose, 10 mM KH2PO4, 5 mM MgCl2, 2 mM HEPES, 1 mM EGTA, 4 mg/ml fatty acid free BSA, and a permeabilizing agent such as digitonin at a concentration of 20 – 200 µg/ml, pH 7.2. The optimal concentration of the permeabilizing agent is highly dependent on the cell type and cell density and needs to be empirically determined for each individual setup. Higher concentrations ensure effective permeabilization, however at the same time harm the integrity and function of mitochondria. At a digitonin concentration of 100 µg/ml, measurement of oxygen consumption rate (OCR) can be initiated after ca. 5 min. Due to breakdown of cytosolic integrity, basal mitochondrial respiration proceeds on a relatively low level under these conditions (Djafarzadeh & Jakob, 2017; Makrecka-Kuka et al., 2015).
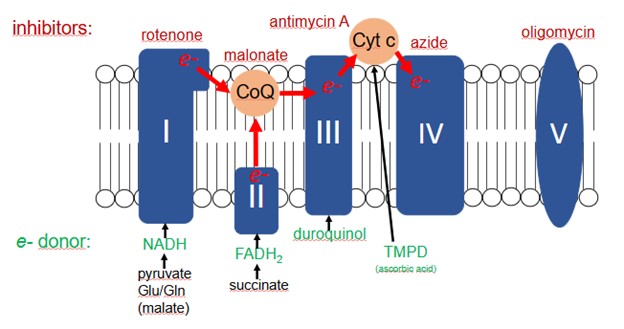
Fig. 1 Mitochondrial respiratory chain, detection of complex III activity. In permeabilized cells, respectively in isolated mitochondria, the overview illustrates the specific input of electrons into the respiratory chain by selected substrates. For the determination of complex III activity, inhibitors of complex I and complex II are added first to prevent electron influx via these complexes originating from residual NADH or FADH2 formation in the cells. Then, the complex III selective electron donor duroquinol is added. The observed rise in OCR directly reflects complex III activity as all other electron input sites are blocked under these conditions. (Toki et al. 2022).
Complex III activity determination requires the addition of complex I and complex II inhibitors. This step ensures that no electron influx, originating from residual NADH or FADH2 from the cell, contributes to oxygen consumption. Then, the complex III substrate duroquinol is added and results in an increase in OCR. If a test compound that inhibits complex III is present, the addition of duroquinol results in an impaired rise in the OCR. If test compounds show an inhibitory effect on OCR following duroquinol addition, it is essential to include testing of complex IV activity. If complex IV is not affected, the conclusion of complex III inhibition can be made (Divakaruni et al., 2022).
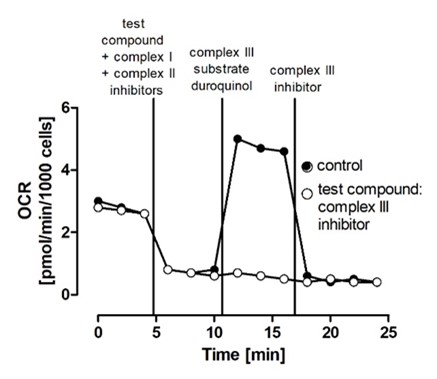
Fig. 2 Exemplary result of complex III detection by an extracellular flux analyzer. Oxygen consumption rate (OCR) detection was started 5 min after addition of permeabilizer (t =0). As test compounds, a complex III inhibitor (white) as well as a compound that does not interfere with complex III (black) were added. Then, complex III substrate duroquinol is added, leading to an increase in OCR. To exclude a contribution of complex IV to the observed inhibition, the selective determination of complex IV activity in a separate experiment is mandatory (Illustrative example provided by Schildknecht S).
Domain of Applicability
Taxonomic: Some sections of taxonomic description were derived from the ENV/JM/MONO(2020)23 Series on testing and assessment no. 327 (Bennekou et al. 2020)
Complex III is a component of the aerobic respiratory chain found in both prokaryotic and eukaryotic organisms.
Complex III is highly conserved among mammals and less conserved vs protozoan, fungi and bacteria (Table 1), especially regarding the QP or QO site (Xia et al. 2013; Trumpower et al. 1990; Dibrova et al. 2013; Fisher et al. 2020; Vincent et al. 2016; Esser et al. 2024). Although the catalytic core of cIII (cytochrome b, cytochrome c₁, and the iron-sulfur protein) is structurally and functionally conserved across species, its overall composition and regulatory mechanisms vary among taxa. In bacteria, cIII contains only the core subunits and structural insertions that aid in stability and lipid interaction (Xia et al. 2013; Trumpower et al. 1990). Yeast and mammals possess additional supernumerary subunits that enhance structural integrity and facilitate complex assembly (Xia et al. 2013). Plants uniquely integrate mitochondrial processing peptidase activity into their cIII, combining electron transport with protein processing (Xia et al. 2013; Maldonado et al. 2021; Xia et al. 2013).
Functional adaptations include species-specific insertions in cytochrome b and c₁, variations in ISP mobility, and differences in lipid and metal ion interactions (Xia et al. 2013). These modifications contribute to enhanced stability, regulatory control, and integration into respiratory supercomplexes. Numerous structural and functional studies have been performed on Complex III isolated from different animal species, e.g. H. sapiens, M. musculus, R. norvegicus, D. rerio (Guo et al. 2017; Xia et al. 2025; Huang et al. 2005; Xia et al. 2013; Garcia-Poyatos et al. 2020; Buck et al. 2014). Subtle differences among mammalian species could be ascribed to the predominant quinone species, characterized by differences in the isoprenoid chain length (Lass et al. 1997; Olgun et al. 2003; Pallotti et al. 2021).
Table 1 reports the percentage of identity of inhibitor-binding subunits obtained by amino acid comparison.
Table 1. Percentage of identity of mitochondrial cIII inhibitor-binding subunit (cytochrome b)
|
cIII – Cytochrome b |
Reference |
||||
|
Species |
Human |
Mouse |
Zebrafish |
P.jiroveci |
Pinho et al. 2013 |
|
Mouse |
79 |
||||
|
Zebrafish |
70 |
74 |
|||
|
P. jiroveci |
51 |
51 |
56 |
||
|
P. falciparum |
41 |
41 |
41 |
41 |
|
|
S. cerevisiae |
50 |
Bennekou et al. 2020 |
|||
Protein BLAST analysis of S. cerevisiae has shown high matches for residues that compose the catalytic core of complex III at the binding site for strobin inhibitors on Qo, and on the respective haeme bH binding site, as well as on Qi and the respective haeme bL binding site (Bennekou et al 2020).
The differences in cytochrome b-Qo (which binds myxothiazol and atovaquone) and cytochrome b-Qi (which binds antimycin) are functionally relevant, since antimycin displays an LC50 value that is over 1000 times lower towards zebrafish and mammals than towards parasites (Pinho et al. 2013). Atovaquone is much more toxic to P. falciparum than to zebrafish and mammals (Pinho et al. 2013).
Comparison of the available crystal structures for CIII of yeast and vertebrates did not show features that would interfere with the coupling process of proton pumping and electron transfer of the Q-cycle mechanism (Berry, De Bari, & Huang, 2013).
Life stage: Given the essentiality of complex III in mitochondrial respiration, mitochondrial function and cell homeostasis, it is inferred that its inhibition is detrimental at all life stages.
Sex: Sex differences in mitochondrial respiratory complex activity are evident across various tissues and life stages in mammals. Data for an explicit sex-dependent influence of complex III however are limited. A meta-analysis of human studies on mitochondrial biology – including complex III activity – indicates lack of binary sex differences in mitochondrial biology (Junker et al, 2022).
References
Bennekou, S. H., van der Stel, W., Carta, G., Eakins, J., Delp, J., Forsby, A., Kamp, H., Gardner, I., Zdradil, B., Pastor, M., Gomes, J. C., White, A., Steger-Hartmann, T., Danen, E. H. J., Leist, M., Walker, P., Jennings, P., & van de Water, B. (2020).ENV/JM/MONO(2020)23 Case study on the use of integrated approaches to testing and assessment for mitochondrial complex-iii-mediated neurotoxicity of azoxystrobin - read-across to other strobilurins: Series on testing and assessment no. 327. Organisation for Economic Co-operation and Development.
Berry, E. A., De Bari, H., & Huang, L.-S. (2013). Unanswered questions about the structure of cytochrome bc1 complexes. Biochimica et Biophysica Acta (BBA) - Bioenergetics, Vol. 1827, No. 11–12, pp. 1258–1277. https://doi.org/10.1016/j.bbabio.2013.04.006
Buck KJ, Walter NA, Denmark DL. Genetic variability of respiratory complex abundance, organization and activity in mouse brain. Genes Brain Behav. 2014 Feb;13(2):135-43. doi: 10.1111/gbb.12101. Epub 2013 Nov 15. PMID: 24164700; PMCID: PMC3946880.
Bujan N, Morén C, García-García FJ, Blázquez A, Carnicer C, Cortés AB, González C, López-Gallardo E, Lozano E, Moliner S, Gort L, Tobías E, Delmiro A, Martin MÁ, Fernández-Moreno MÁ, Ruiz-Pesini E, Garcia-Arumí E, Rodríguez-Aguilera JC, Garrabou G. Multicentric Standardization of Protocols for the Diagnosis of Human Mitochondrial Respiratory Chain Defects. Antioxidants (Basel). 2022 Apr 8;11(4):741. doi: 10.3390/antiox11040741. PMID: 35453428; PMCID: PMC9027926.
Creed S, McKenzie M. Measurement of Mitochondrial Membrane Potential with the Fluorescent Dye Tetramethylrhodamine Methyl Ester (TMRM). Methods Mol Biol. 2019;1928:69-76. doi: 10.1007/978-1-4939-9027-6_5. PMID: 30725451.
Delp J, Funke M, Rudolf F, Cediel A, Bennekou SH, van der Stel W, Carta G, Jennings P, Toma C, Gardner I, van de Water B, Forsby A, Leist M. Development of a neurotoxicity assay that is tuned to detect mitochondrial toxicants. Arch Toxicol. 2019 Jun;93(6):1585-1608. doi: 10.1007/s00204-019-02473-y. Epub 2019 Jun 12. PMID: 31190196.
Desousa BR, Kim KK, Jones AE, Ball AB, Hsieh WY, Swain P, Morrow DH, Brownstein AJ, Ferrick DA, Shirihai OS, Neilson A, Nathanson DA, Rogers GW, Dranka BP, Murphy AN, Affourtit C, Bensinger SJ, Stiles L, Romero N, Divakaruni AS. Calculation of ATP production rates using the Seahorse XF Analyzer. EMBO Rep. 2023 Oct 9;24(10):e56380. doi: 10.15252/embr.202256380. Epub 2023 Aug 7. PMID: 37548091; PMCID: PMC10561364.
Dibrova DV, Cherepanov DA, Galperin MY, Skulachev VP, Mulkidjanian AY. Evolution of cytochrome bc complexes: from membrane-anchored dehydrogenases of ancient bacteria to triggers of apoptosis in vertebrates. Biochim Biophys Acta. 2013 Nov-Dec;1827(11-12):1407-27. doi: 10.1016/j.bbabio.2013.07.006. Epub 2013 Jul 19. PMID: 23871937; PMCID: PMC3839093.
Divakaruni AS, Rogers GW, Murphy AN. Measuring Mitochondrial Function in Permeabilized Cells Using the Seahorse XF Analyzer or a Clark-Type Oxygen Electrode. Curr Protoc Toxicol. 2014 May 27;60:25.2.1-16. doi: 10.1002/0471140856.tx2502s60. PMID: 24865646.
Divakaruni AS, Jastroch M. A practical guide for the analysis, standardization and interpretation of oxygen consumption measurements. Nat Metab. 2022 Aug;4(8):978-994. doi: 10.1038/s42255-022-00619-4. Epub 2022 Aug 15. PMID: 35971004; PMCID: PMC9618452.
Djafarzadeh S, Jakob SM. High-resolution Respirometry to Assess Mitochondrial Function in Permeabilized and Intact Cells. J Vis Exp. 2017 Feb 8;(120):54985. doi: 10.3791/54985. PMID: 28287504; PMCID: PMC5408571.
Dmitriev RI, Papkovsky DB. Optical probes and techniques for O2 measurement in live cells and tissue. Cell Mol Life Sci. 2012 Jun;69(12):2025-39. doi: 10.1007/s00018-011-0914-0. Epub 2012 Jan 17. PMID: 22249195; PMCID: PMC3371327.
Espinosa JA, Pohan G, Arkin MR, Markossian S. Real-Time Assessment of Mitochondrial Toxicity in HepG2 Cells Using the Seahorse Extracellular Flux Analyzer. Curr Protoc. 2021 Mar;1(3):e75. doi: 10.1002/cpz1.75. Erratum in: Curr Protoc. 2022 Aug;2(8):e551. doi: 10.1002/cpz1.551. PMID: 33735523.
Esser L, Zhou F, Zeher A, Wu W, Huang R, Yu C-A, Lane KD, Wellems TE, Xia D, Structure of complex III with bound antimalarial agent CK-2-68 provides insights into selective inhibition of Plasmodium cytochrome bc1 complexes, 2023, J Biol Chem, 299(7):104860
Esser L, Xia D. Mitochondrial Cytochrome bc1 Complex as Validated Drug Target: A Structural Perspective. Trop Med Infect Dis. 2024 Feb 1;9(2):39. doi: 10.3390/tropicalmed9020039. PMID: 38393128; PMCID: PMC10892539.
Fisher N, Meunier B, Biagini GA. The cytochrome bc1 complex as an antipathogenic target. FEBS Lett. 2020 Sep;594(18):2935-2952. doi: 10.1002/1873-3468.13868. Epub 2020 Jul 9. PMID: 32573760.
García-Poyatos C, Cogliati S, Calvo E, Hernansanz-Agustín P, Lagarrigue S, Magni R, Botos M, Langa X, Amati F, Vázquez J, Mercader N, Enríquez JA. Scaf1 promotes respiratory supercomplexes and metabolic efficiency in zebrafish. EMBO Rep. 2020 Jul 3;21(7):e50287. doi: 10.15252/embr.202050287. Epub 2020 Jun 4. PMID: 32496654; PMCID: PMC7332985.
Guo R, Zong S, Wu M, Gu J, Yang M. Architecture of Human Mitochondrial Respiratory Megacomplex I2III2IV2. Cell. 2017 Sep 7;170(6):1247-1257.e12. doi: 10.1016/j.cell.2017.07.050. Epub 2017 Aug 24. PMID: 28844695.
Huang LS, Cobessi D, Tung EY, Berry EA. Binding of the respiratory chain inhibitor antimycin to the mitochondrial bc1 complex: a new crystal structure reveals an altered intramolecular hydrogen-bonding pattern. J Mol Biol. 2005 Aug 19;351(3):573-97. doi: 10.1016/j.jmb.2005.05.053. PMID: 16024040; PMCID: PMC1482829.
Hunte C, Palsdottir H, Trumpower BL, Protonmotive pathways and mechanisms in the cytochrome bc1 complex, 2003, FEBS Lett, 545(1):39-46
Junker A, Wang J, Gouspillou G, Ehinger JK, Elmér E, Sjövall F, Fisher-Wellman KH, P Neufer PD, Molina AJA, Ferrucci L, Picard M, Human studies of mitochondrial biology demonstrate an overall lack of binary sex differences: A multivariate meta-analysis, 2022, FASEB J, 36(2):e22146
Krähenbühl S, Talos C, Wiesmann U, Hoppel CL. Development and evaluation of a spectrophotometric assay for complex III in isolated mitochondria, tissues and fibroblasts from rats and humans. Clin Chim Acta. 1994 Oct 31;230(2):177-87. doi: 10.1016/0009-8981(94)90270-4. PMID: 7834868.
Lass A, Agarwal S, Sohal RS. Mitochondrial ubiquinone homologues, superoxide radical generation, and longevity in different mammalian species. J Biol Chem. 1997 Aug 1;272(31):19199-204. doi: 10.1074/jbc.272.31.19199. PMID: 9235911; PMCID: PMC2839905.
Lei XH, Bochner BR. Optimization of cell permeabilization in electron flow based mitochondrial function assays. Free Radic Biol Med. 2021 Dec;177:48-57. doi: 10.1016/j.freeradbiomed.2021.10.014. Epub 2021 Oct 14. PMID: 34656699.
Leonard AP, Cameron RB, Speiser JL, Wolf BJ, Peterson YK, Schnellmann RG, Beeson CC, Rohrer B. Quantitative analysis of mitochondrial morphology and membrane potential in living cells using high-content imaging, machine learning, and morphological binning. Biochim Biophys Acta. 2015 Feb;1853(2):348-60. doi: 10.1016/j.bbamcr.2014.11.002. Epub 2014 Nov 13. PMID: 25447550; PMCID: PMC4289477.
Letts JA & Sazanov LA, Clarifying the supercomplex: the higher-order organization of the mitochondrial electron transport chain, 2017, Nat Struct Mol Biol, 24(10):800-808
Li Z, Graham BH. Measurement of mitochondrial oxygen consumption using a Clark electrode. Methods Mol Biol. 2012;837:63-72. doi: 10.1007/978-1-61779-504-6_5. PMID: 22215541; PMCID: PMC8711122.
Luo B, Ning Y, Rao B, Comprehensive Overview of β-Methoxyacrylate Derivatives as Cytochrome bc1 Inhibitors for Novel Pesticide Discovery, 2022, J Agric Food Chem, 70(50):15615)
Makrecka-Kuka M, Krumschnabel G, Gnaiger E. High-Resolution Respirometry for Simultaneous Measurement of Oxygen and Hydrogen Peroxide Fluxes in Permeabilized Cells, Tissue Homogenate and Isolated Mitochondria. Biomolecules. 2015 Jun 29;5(3):1319-38. doi: 10.3390/biom5031319. PMID: 26131977; PMCID: PMC4598754.
Maldonado M, Guo F, Letts JA. Atomic structures of respiratory complex III2, complex IV, and supercomplex III2-IV from vascular plants. Elife. 2021 Jan 19;10:e62047. doi: 10.7554/eLife.62047. PMID: 33463523; PMCID: PMC7815315.
Melnikov PV, Alexandrovskaya AY, Naumova AO, Arlyapov VA, Kamanina OA, Popova NM, Zaitsev NK, Yashtulov NA. Optical Oxygen Sensing and Clark Electrode: Face-to-Face in a Biosensor Case Study. Sensors (Basel). 2022 Oct 8;22(19):7626. doi: 10.3390/s22197626. PMID: 36236726; PMCID: PMC9572888.
Mookerjee SA, Gerencser AA, Nicholls DG, Brand MD. Quantifying intracellular rates of glycolytic and oxidative ATP production and consumption using extracellular flux measurements. J Biol Chem. 2017 Apr 28;292(17):7189-7207. doi: 10.1074/jbc.M116.774471. Epub 2017 Mar 7. Erratum in: J Biol Chem. 2018 Aug 10;293(32):12649-12652. doi: 10.1074/jbc.AAC118.004855. PMID: 28270511; PMCID: PMC5409486.
Motawe ZY, Abdelmaboud SS, Breslin JW. Evaluation of Glycolysis and Mitochondrial Function in Endothelial Cells Using the Seahorse Analyzer. Methods Mol Biol. 2024;2711:241-256. doi: 10.1007/978-1-0716-3429-5_20. PMID: 37776463; PMCID: PMC11368073.
Niklas J, Melnyk A, Yuan Y, Heinzle E. Selective permeabilization for the high-throughput measurement of compartmented enzyme activities in mammalian cells. Anal Biochem. 2011 Sep 15;416(2):218-27. doi: 10.1016/j.ab.2011.05.039. Epub 2011 May 30. PMID: 21683676.
Olgun A, Akman S, Tezcan S, Kutluay T. The effect of isoprenoid side chain length of ubiquinone on life span. Med Hypotheses. 2003 Mar;60(3):325-7. doi: 10.1016/s0306-9877(02)00392-4. PMID: 12581604.
Pallotti F, Bergamini C, Lamperti C, Fato R. The Roles of Coenzyme Q in Disease: Direct and Indirect Involvement in Cellular Functions. Int J Mol Sci. 2021 Dec 23;23(1):128. doi: 10.3390/ijms23010128. PMID: 35008564; PMCID: PMC8745647.
Pinho BR, Santos MM, Fonseca-Silva A, Valentão P, Andrade PB, Oliveira JM. How mitochondrial dysfunction affects zebrafish development and cardiovascular function: an in vivo model for testing mitochondria-targeted drugs. Br J Pharmacol. 2013 Jul;169(5):1072-90. doi: 10.1111/bph.12186. PMID: 23758163; PMCID: PMC3696330.
Plitzko B, Loesgen S. Measurement of Oxygen Consumption Rate (OCR) and Extracellular Acidification Rate (ECAR) in Culture Cells for Assessment of the Energy Metabolism. Bio Protoc. 2018 May 20;8(10):e2850. doi: 10.21769/BioProtoc.2850. PMID: 34285967; PMCID: PMC8275291.
Salabei JK, Gibb AA, Hill BG. Comprehensive measurement of respiratory activity in permeabilized cells using extracellular flux analysis. Nat Protoc. 2014 Feb;9(2):421-38. doi: 10.1038/nprot.2014.018. Epub 2014 Jan 23. PMID: 24457333; PMCID: PMC4063296.
Silva AM, Oliveira PJ. Evaluation of respiration with clark type electrode in isolated mitochondria and permeabilized animal cells. Methods Mol Biol. 2012;810:7-24. doi: 10.1007/978-1-61779-382-0_2. PMID: 22057558.
Scaduto RC Jr, Grotyohann LW. Measurement of mitochondrial membrane potential using fluorescent rhodamine derivatives. Biophys J. 1999 Jan;76(1 Pt 1):469-77. doi: 10.1016/S0006-3495(99)77214-0. PMID: 9876159; PMCID: PMC1302536.
Toki E, Goto S, Setoguchi S, Terada K, Watase D, Yamakawa H, Yamada A, Koga M, Kubota K, Iwasaki K, Karube Y, Matsunaga K, Takata J. Delivery of the reduced form of vitamin K2(20) to NIH/3T3 cells partially protects against rotenone induced cell death. Sci Rep. 2022 Nov 18;12(1):19878. doi: 10.1038/s41598-022-24456-3. PMID: 36400879; PMCID: PMC9674836.
Trumpower BL. Cytochrome bc1 complexes of microorganisms. Microbiol Rev. 1990 Jun;54(2):101-29. doi: 10.1128/mr.54.2.101-129.1990. PMID: 2163487; PMCID: PMC372766.
Valdebenito GE, Duchen MR. Monitoring Mitochondrial Membrane Potential in Live Cells Using Time-Lapse Fluorescence Imaging. Methods Mol Biol. 2022;2497:319-324. doi: 10.1007/978-1-0716-2309-1_22. PMID: 35771453.
Vincent BM, Langlois JB, Srinivas R, Lancaster AK, Scherz-Shouval R, Whitesell L, Tidor B, Buchwald SL, Lindquist S. A Fungal-Selective Cytochrome bc1 Inhibitor Impairs Virulence and Prevents the Evolution of Drug Resistance. Cell Chem Biol. 2016 Aug 18;23(8):978-991. doi: 10.1016/j.chembiol.2016.06.016. Epub 2016 Aug 11. PMID: 27524297; PMCID: PMC5159300.
Wong A, Cortopassi GA. High-throughput measurement of mitochondrial membrane potential in a neural cell line using a fluorescence plate reader. Biochem Biophys Res Commun. 2002 Nov 15;298(5):750-4. doi: 10.1016/s0006-291x(02)02546-9. PMID: 12419317.
Xia D, Yu CA, Kim H, Xia JZ, Kachurin AM, Zhang L, Yu L, Deisenhofer J. Crystal structure of the cytochrome bc1 complex from bovine heart mitochondria. Science. 1997 Jul 4;277(5322):60-6. doi: 10.1126/science.277.5322.60. Erratum in: Science 1997 Dec 19;278(5346):2037. PMID: 9204897; PMCID: PMC12235523.
Xia D, Esser L, Tang WK, Zhou F, Zhou Y, Yu L, Yu CA. Structural analysis of cytochrome bc1 complexes: implications to the mechanism of function. Biochim Biophys Acta. 2013 Nov-Dec;1827(11-12):1278-94. doi: 10.1016/j.bbabio.2012.11.008. Epub 2012 Nov 29. PMID: 23201476; PMCID: PMC3593749.
Yoo I, Ahn I, Lee J, Lee N. Extracellular flux assay (Seahorse assay): Diverse applications in metabolic research across biological disciplines. Mol Cells. 2024 Aug;47(8):100095. doi: 10.1016/j.mocell.2024.100095. Epub 2024 Jul 18. PMID: 39032561; PMCID: PMC11374971.
Zhang J, Zhang Q. Using Seahorse Machine to Measure OCR and ECAR in Cancer Cells. Methods Mol Biol. 2019;1928:353-363. doi: 10.1007/978-1-4939-9027-6_18. PMID: 30725464.